Everyone’s into analytics and statistics right now plus it’s the first step of the growth hacking cycle (another topic I’m obsessed with because I just read Sean Ellis’s Hacking Growth book). So it’s obviously a must-know topic for any marketer.
There’s one thing I realised that I’ve been very wrong about – it is to use the term analytics & statistics interchangeably. It’s two different things that look similar but serve very different purposes. Here’s how.
What is analytics
To find the answer for this I went to the ever-reliable Professor Google to look it up and I found 3 definitions that are nice.
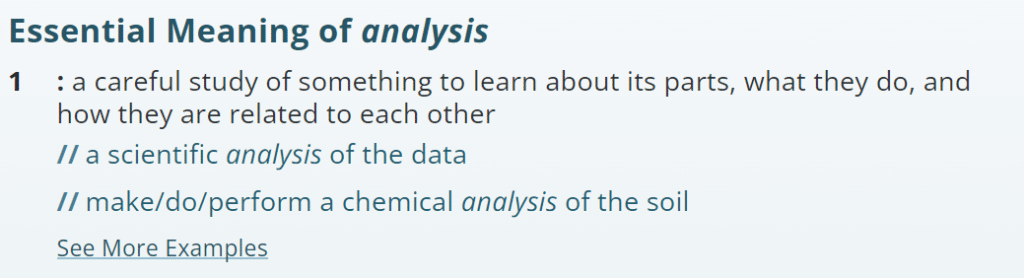
Defined by Merriam Webster
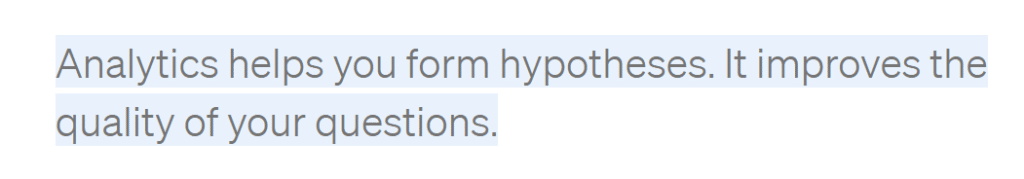
Defined by towardsdatascience.com (my favourite)
If you squint your eyes and put the 3 definitions together, you can see that they all mean to look something up about something that already exists so that you know the answer to your questions. Sounds easy right, why do you need someone’s job dedicated to doing just that? When I read more into the article by Towards data science, it explains that answering a specific question with data is much easier than generating inspiration about which questions are worth asking in the first place.
To put it simply I find analytics to be like doing the research review for the reports I did in university and to come up with questions that has not been answered in any of the past research done.
What is statistics
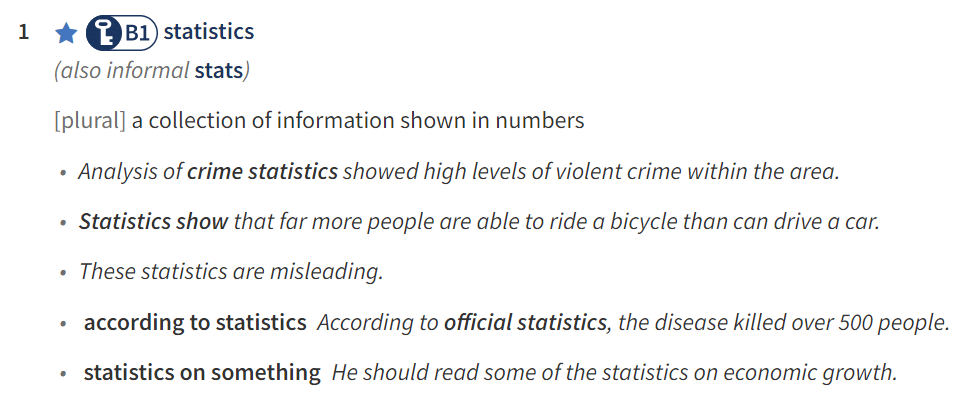
Definition by Oxford Dictionary
Definition by Urban Dictionary

Definition by Towards data science
When combining all the definitions, it seems that statistics is used to test a guess to see if it would be true when you scale it up.
Analytics vs Statistics
I found Towards data science’s explanation on analytics vs statistics to be the best and clearest at differentiating the two and how they are complementary to each other.
It states that analytics helps you find and improve the quality of the questions to ask. While statistics help to find and improve the quality of the answer. They come hand in hand to solve data problems. I start with analytics, move on to statistics, and go back to analytics to repeat the cycle.
Why I want to know and apply both Analytics and statistics to marketing
After learning about the definition and purpose of Analytics and statistics, I’m pretty convinced that I need to know and apply both as a marketer in order to truly be a data-driven marketer.
As mentioned earlier, analytics form & improves the questions to ask and statistics find and improve the quality of the answers. If I only knew analytics, I would only know how to raise questions but I would know how to answer them or find a quality answer. While only knowing statistics, I would have quality answers to pointless questions.
I think knowing one is okay but to be really good at marketing, having knowledge of both analytics and statistics would be necessary.
How I’m applying analytics to marketing
I’m probably doing the same as the average marketer out there:
I use website analytics tools for reports on website traffic performance. I’ve used a bunch of them before, from Google Analytics; Smartlook; Hotjar; Yandex Metrica; and more. Each with their own strengths.
What I would usually do is to look at the website traffic performance for the overall numbers like website visits, bounce rate, time spent on the website, and which sources & mediums are they coming from. Should I see anything interesting, I would dive deeper into the data to find out why it is happening.
For example, in a situation where I noticed that there’s a relatively high Facebook ad CTR but the form conversion rate of the landing page is relatively low. I then investigate further by looking at the page experience from a technical aspect and copywriting aspect. For this, I usually do check for technical issues first, by checking the loading times of the landing page and the forms. If that is not the problem, I would look at sample of sessions of such users to find out what’s happening and it could be that for some reason, the form button colour blends in with the form background.
But to use it for more than just identifying problems, I could also use it to identify things that are working really well. Like for example, I noticed that leads that are coming from Linkedin may be less than those that are coming from Twitter but those leads are of high quality that matches our intended customer profile (ICP) or have high levels of intention. From that finding, I would probably want to test if we double up on Linkedin marketing activities, it would incrementally improve our marketing results. This goes to my next part on how I’m applying statistics.
My plan for applying statistics to marketing
To be honest, I have not applied any form of statistics in my work. I’m doing a bunch of experiments for marketing but not in a very scientific manner that would require some form of statistics application. Which I realised is a bad practice after reading Sean Ellis’s Hacking Growth book because I need to test for statistical significance to ensure that the result achieved was due to the new variable I introduced during the experiment.
I’m still learning my way around applying statistics in marketing but I have a rough idea of how it should be done. Essentially, for any experiment that I do (which should be based on analytics), I need to have a “control” in order to prove that the new idea is worthwhile to implement & scale. The Facebook representatives at the She Loves Data workshop call it to test for incrementality.
Incrementality is a way to measure an event that wouldn’t have occurred without a specific interaction, such as an ad view, and that resulted in the desired outcome, such as a conversion. In the context of ads, it can be referred to as the measurement of ad effectiveness.
Measuring Impact: The Beginner’s Guide to Incrementality
So here’s how I would do it:
Step 1: Have a structure to my experiments
If I had paid better attention in my market research module in school, I would have learned, applied, and memorised this by heart. So, essentially all my experiments should be made up of a hypothesis, a control, a dependent variable, an independent variable, and an experiment timeline or goal.
I also needed to determine my sample size which I based on this article: https://blog.hubspot.com/marketing/email-a-b-test-sample-size-testing-time
Step 2: Run the experiment
Set the experiment as mentioned earlier, let it run for a while, and wait for the results.
Step 3: Test marketing experiments for incrementality
As mentioned earlier, I need to find out if the results of the test were actually caused by the introduction of a new variable and not by something else. To do so, I would take the results of the experiment and apply one of the many tests for statistical significance. After finding out if the results were significant, then I would make a conclusion on this experiment.
Good reads on statistical significance:
- How to Understand & Calculate Statistical Significance [Example]
- A Data-Driven Marketers’ Guide to Calculating Statistical Significance
Applying statistics to a Facebook Ads experiment
If I read and learn all about this but don’t apply, what’s the point right? So I applied this on a Facebook Ad that I was running.
The context is that I had an ad that was performing “okay” but during a call with a Facebook Ad Expert, I was recommended to change the ad optimisation method from doing it based on Landing Page Views to Link Clicks. I was curious to see if this was true by testing it out.
I started off by having a hypothesis “changing the Facebook Ads optimisation based on Link Clicks will not improve the CTR of the ad when compared to optimising is based on landing page views”. From the hypothesis, the independent variable is the method of optimisation and the dependent variable is the CTR.
To ensure the test is done in a random but controlled manner, I did it using Facebook’s A/B testing tool. And I decided to run it for 14 days to get enough of a sample size.
The expected results
| Converted? | Link Click Optimisation | Landing Page View Optimisation |
| Yes | 88.1 | 43.4 |
| No | 82,202.90 | 40,477.6 |
| Total Visitors | 82291 | 40521 |
The results after 14 days
| Converted? | Link Click Optimisation | Landing Page View Optimisation |
| Yes | 27 | 16 |
| No | 82,264.00 | 40,505.00 |
| Total Visitors | 82291 | 40521 |
The statistical significance test results
After getting the results, I checked for statistical significance to find out if I repeated the same test, would I still get similar results and that this result did not happen by chance.
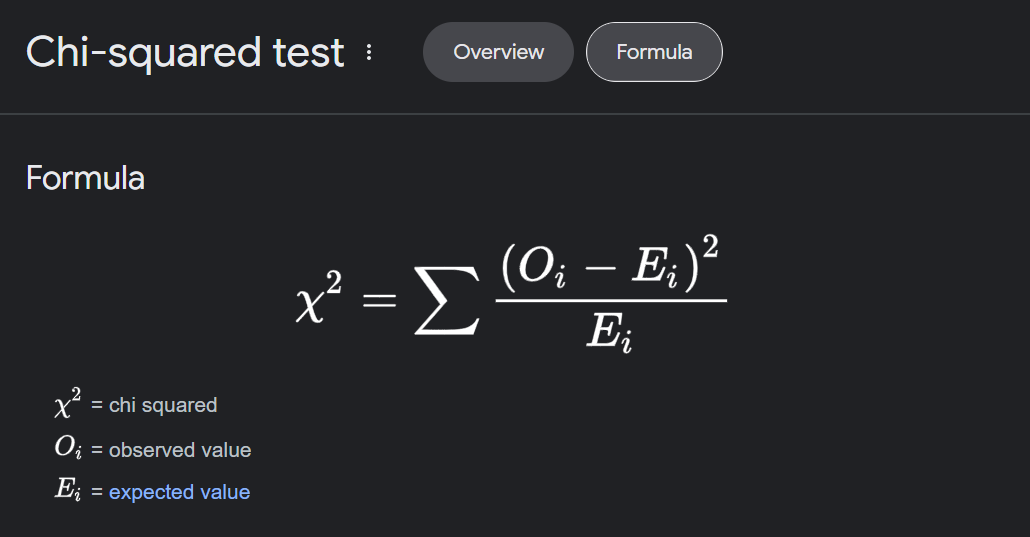
For this situation, I used the chi-square test (see the formula in the image below) to calculate the significance of the results. The value I received was 19.40.
Conclusion of this test
In order to determine if the above-mentioned value is good or bad, I needed to take it and compare it to the chi-square table for the confidence level of 0.95 and the level of freedom of 1. When I did so, I found that the value was larger than what was indicated in the table. Hence the results of this experiment are statistically significant and therefore using Link Click Optimisation would be a better option in generating traffic for the website than using Landing Page View Optimisation.
Recommended content around analytics & statistics
If you’re curious about analytics & statistics and how you can use them in marketing, you can try reading the stuff I read to get the understanding to write this essay. Here’s the list:
- Hacking Growth – To convince you why it is important to be data-driven for marketing
- Towards data science’s article on Analytics & statistics – to get a clear understanding of what the two are, how they work together, and why you need it for marketing
- Technical Marketing Handbook podcast – Useful technical knowledge around marketing, mostly on how to gather the best form of analytics and the challenges of it
- Nacho analytics’s blog post titled A data-driven marketer’s guide to calculating statistical significance – How to calculate statistical significance using free tools
Ping me if you have any recommended content for me to add or read that is super useful to understand analytics and statistics better.
That’s all I can say about analytics & statistics for marketing at the moment, I’m still learning about it.
In the meantime, selamat ✌🏽 (peace out in Malay)
P.S. Next piece will be a deep dive on analytics, I actually wanted to go into statistics first but it would be dumb of me to do so after finding out the relation between the two.
Pingback: 2whimper
Pingback: clindamicina precio
Comments are closed.